Analytics — Simple Guide
This guide explains the Analytics part of the system in plain, everyday language. No technical words. If you can use email, you can use this.
Analytics is where you look at numbers and charts about how your organisation is doing. It has these parts:
- Analytics Hub — your starting point for reports
- Reports — a quick, simple summary
- Report Builder — build your own custom report
1. Analytics Hub
What is this for?
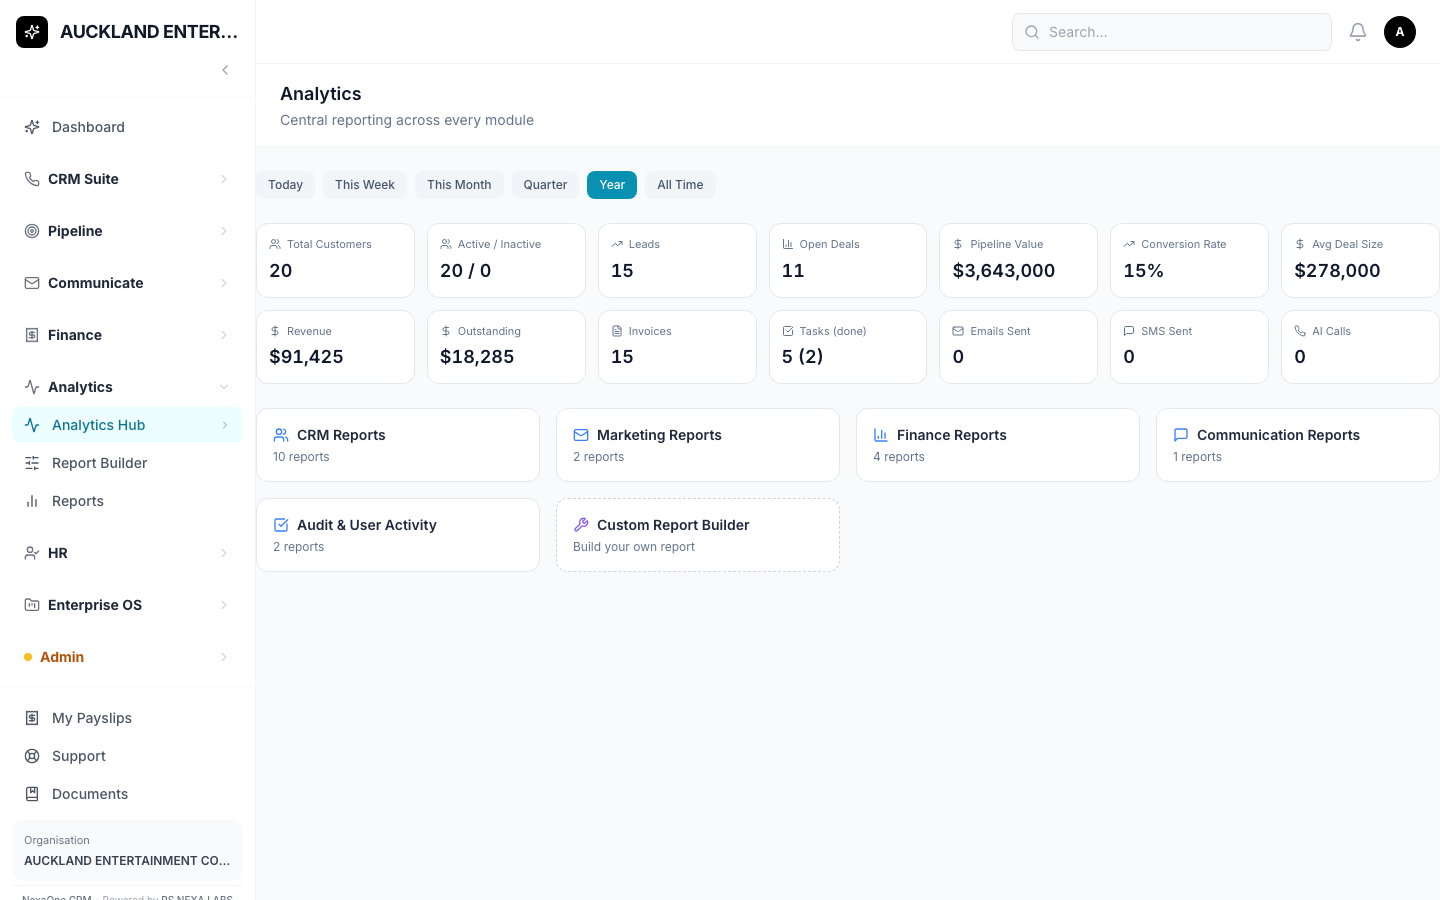
The main screen for looking at ready-made reports — sales, clients, money coming in, and more, depending on what's switched on for your organisation.
Where do I find it?
Click Analytics on the left-hand menu.
How do I use it?
- Pick a report to open.
- Choose a date range at the top — Today, This Week, This Month, This Quarter, This Year, or a custom range.
- Use the filters and search box to narrow things down.
- Switch between a table and different chart styles.
- Click Export CSV to download it, or use your browser's Print option to save it as a PDF.
Tip: You can star a report as a favourite, or save your own filtered version as a template, so you don't have to set it up again next time. You can also set a report to be emailed to someone automatically — daily, weekly, or monthly.
2. Reports
What is this for?
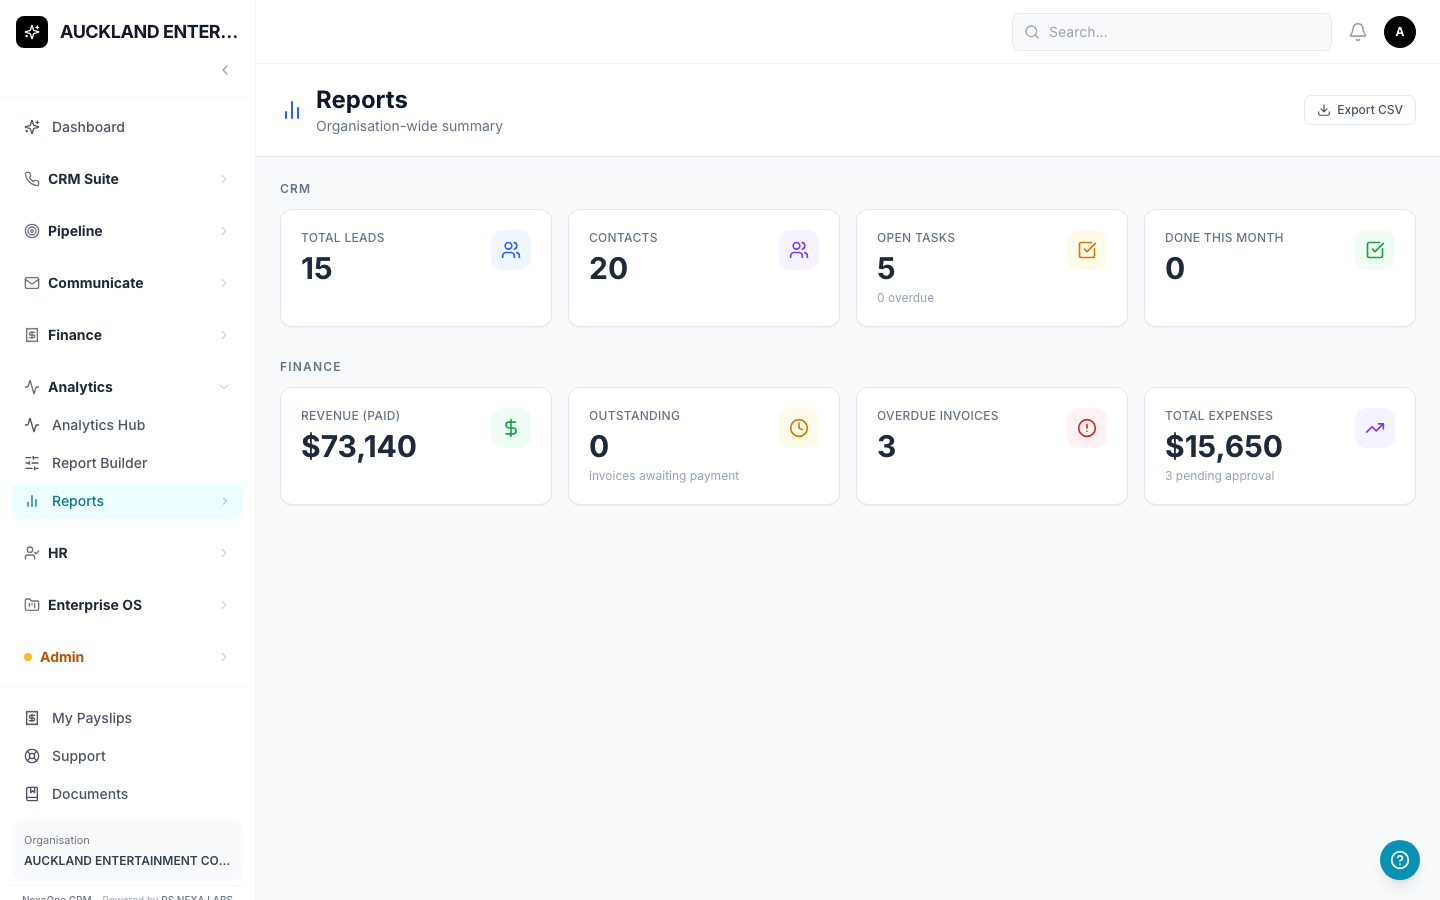
A simpler, one-page summary — good for a quick check without picking filters.
Where do I find it?
Click Analytics, then Reports.
There's one button here — Export CSV — to download everything you see.
3. Report Builder
What is this for?
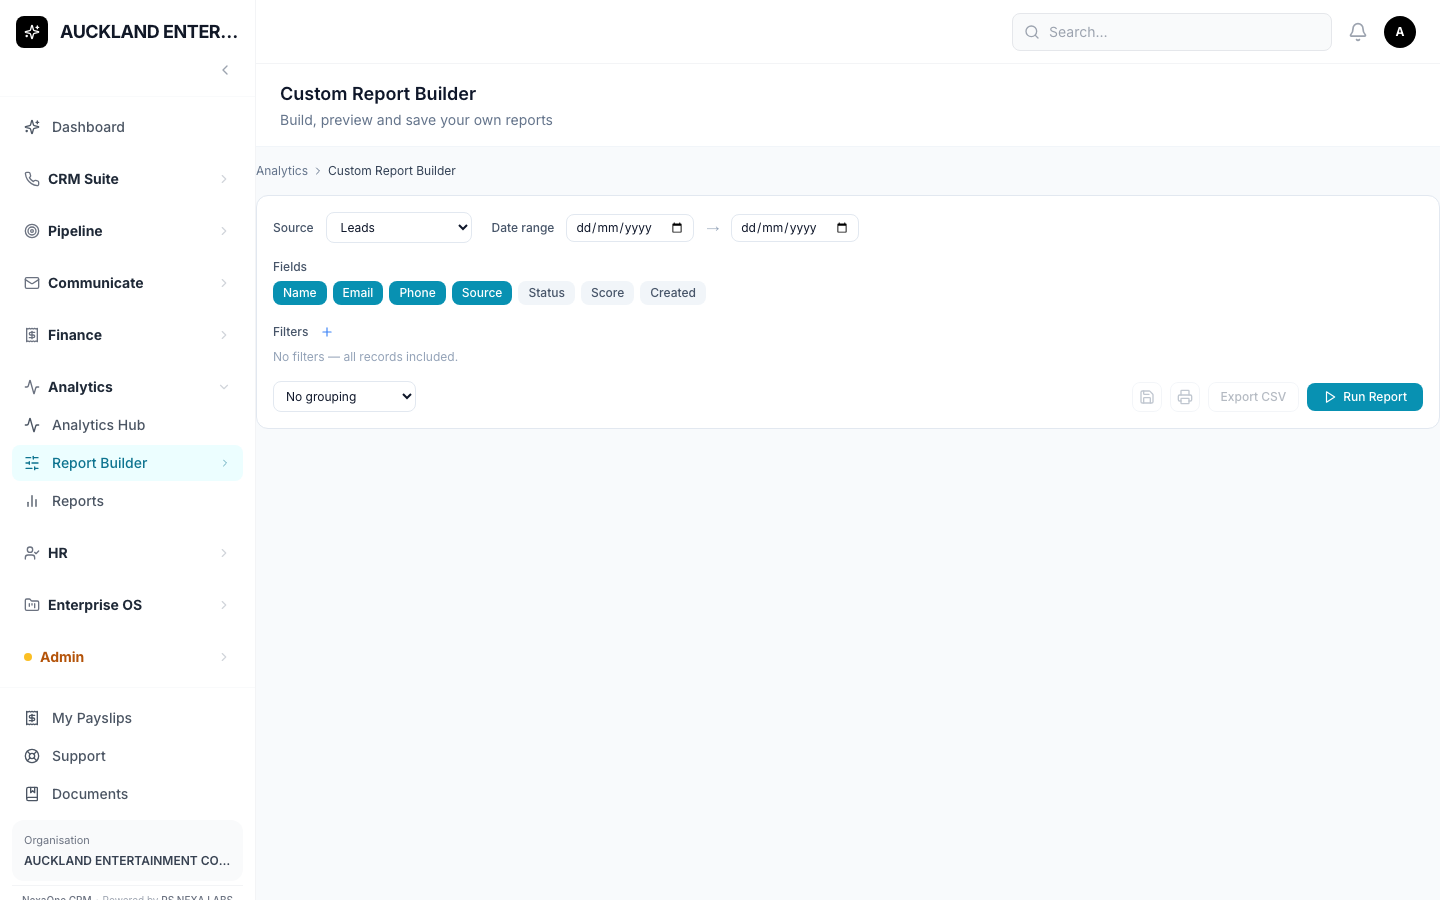
For building your own custom report, when the ready-made ones under the Analytics Hub don't show exactly what you need.
Where do I find it?
Click Analytics, then Report Builder.
How do I use it?
- Pick what you want to build a report about (for example, Contacts or Invoices).
- Choose which columns (fields) to include.
- Add any filters you want.
- Click Run to see your results.
- Export CSV, print it, or save it so you can come back to it later.
Common Questions
A report I expected to see isn't there. The reports you can see depend on which parts of the system are switched on for your organisation. If you think something's missing, ask your admin.
What's the difference between Reports and the Analytics Hub? Reports is a quick, simple, one-click summary. The Analytics Hub is where you pick date ranges, apply filters, and dig deeper into a specific report.
I can't find something I'm looking for — what do I do? Try the search box on whichever screen you're on.
I clicked a button and it says "Module Not Enabled." That feature hasn't been switched on for your organisation yet. It's not a mistake on your part — ask your manager or admin if you think you should have access to it.